Data Connector (Power BI)

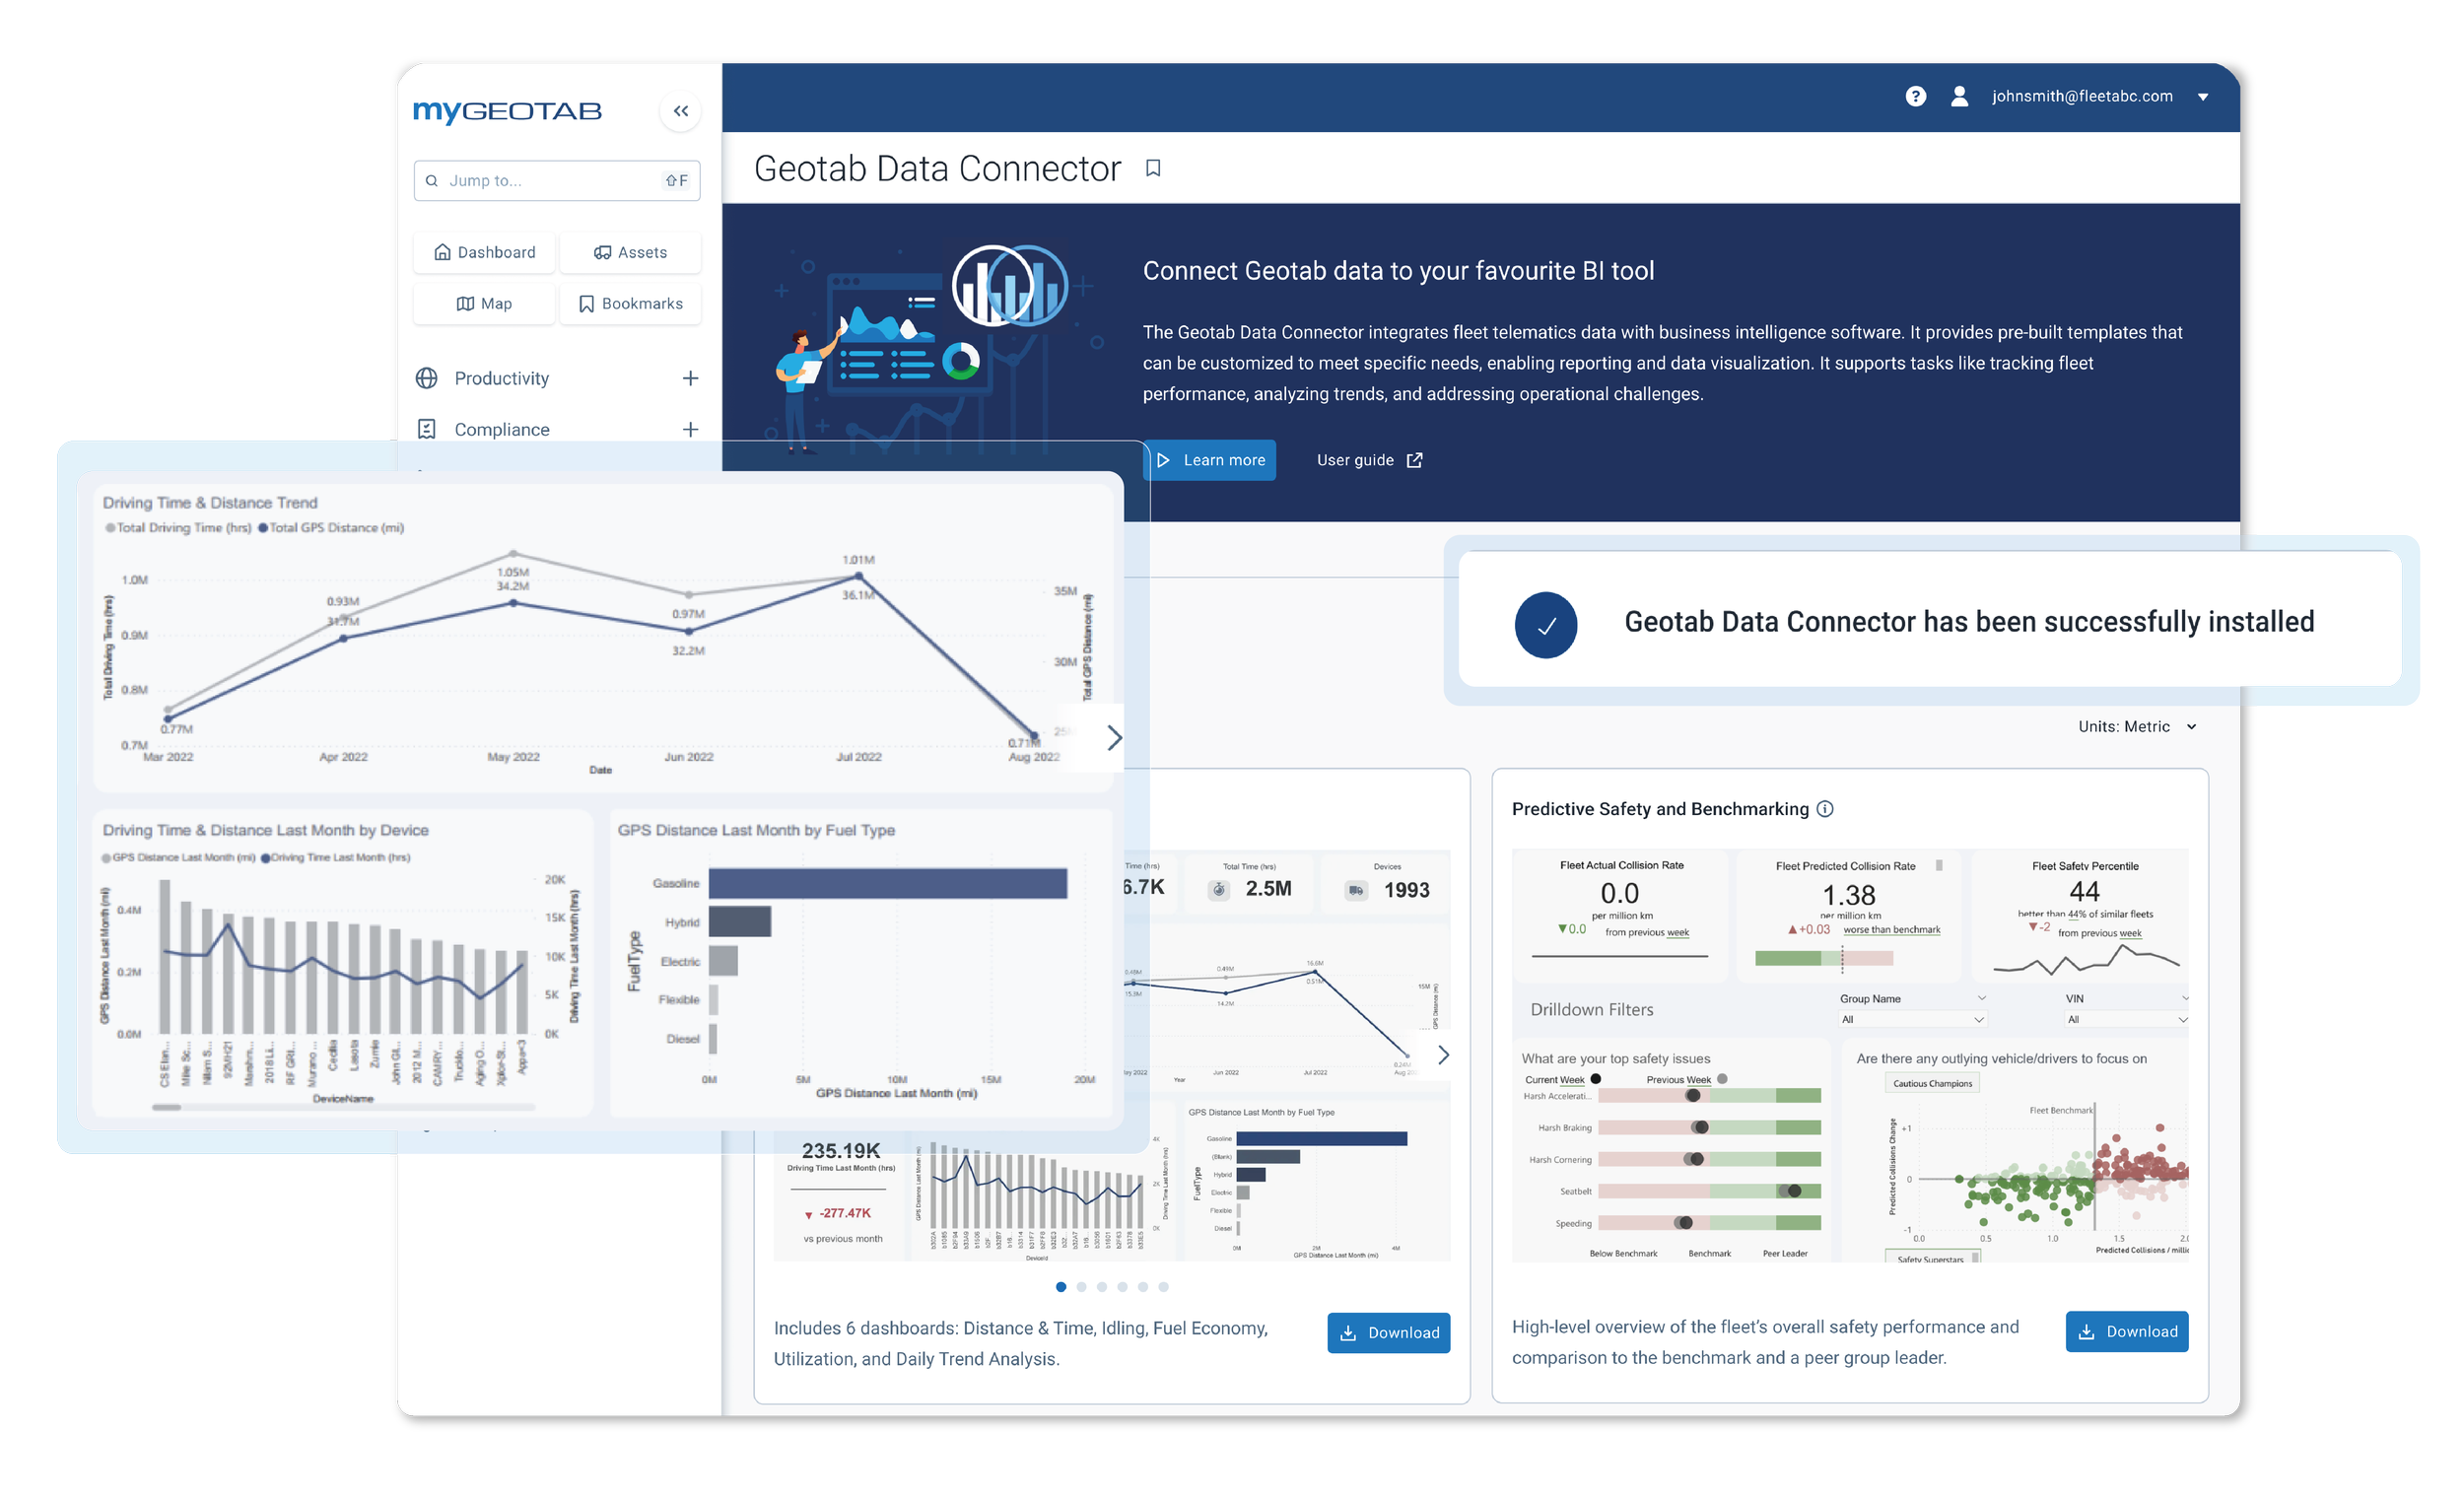
Digital dashboard interface showing various charts, graphs, and metrics related to fleet data management, with a pop-up notification indicating successful installation of a data connector.

Tenging við Business Central Power BI

Power BI
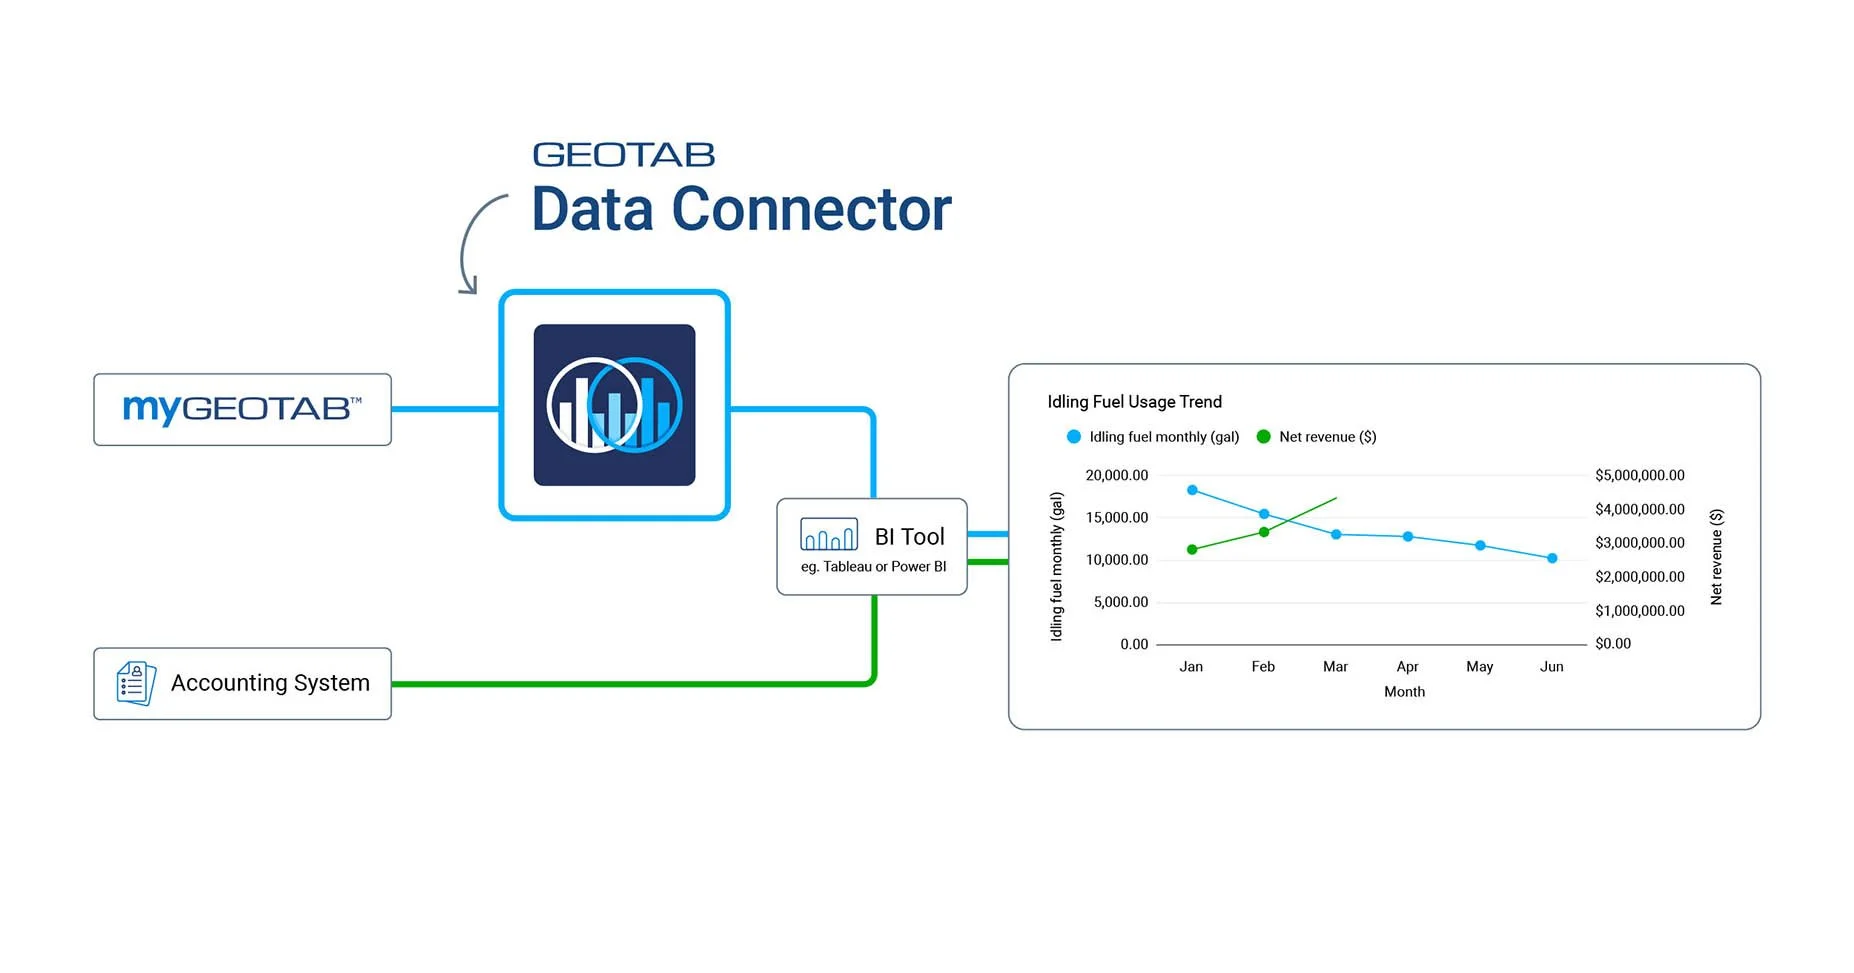
Diagram showing data flow from myGEOTAB to an analytics dashboard, with sources including an accounting system and BI tools, illustrating idle fuel usage and net revenue trends.
Power BI tenging:

Tilbúin tenging við BC

Tilbúnar skýrslur og sniðmát í Power BI

Betri yfirsýn yfir gögn og flotann

Fyrir stjórnendur og greiningaraðila

Fylgstu með þróun (trends)

Sjáðu lausnina →

Dýpri innsýn og framsetning gagna með skilvirkari hætti

Vinnum saman
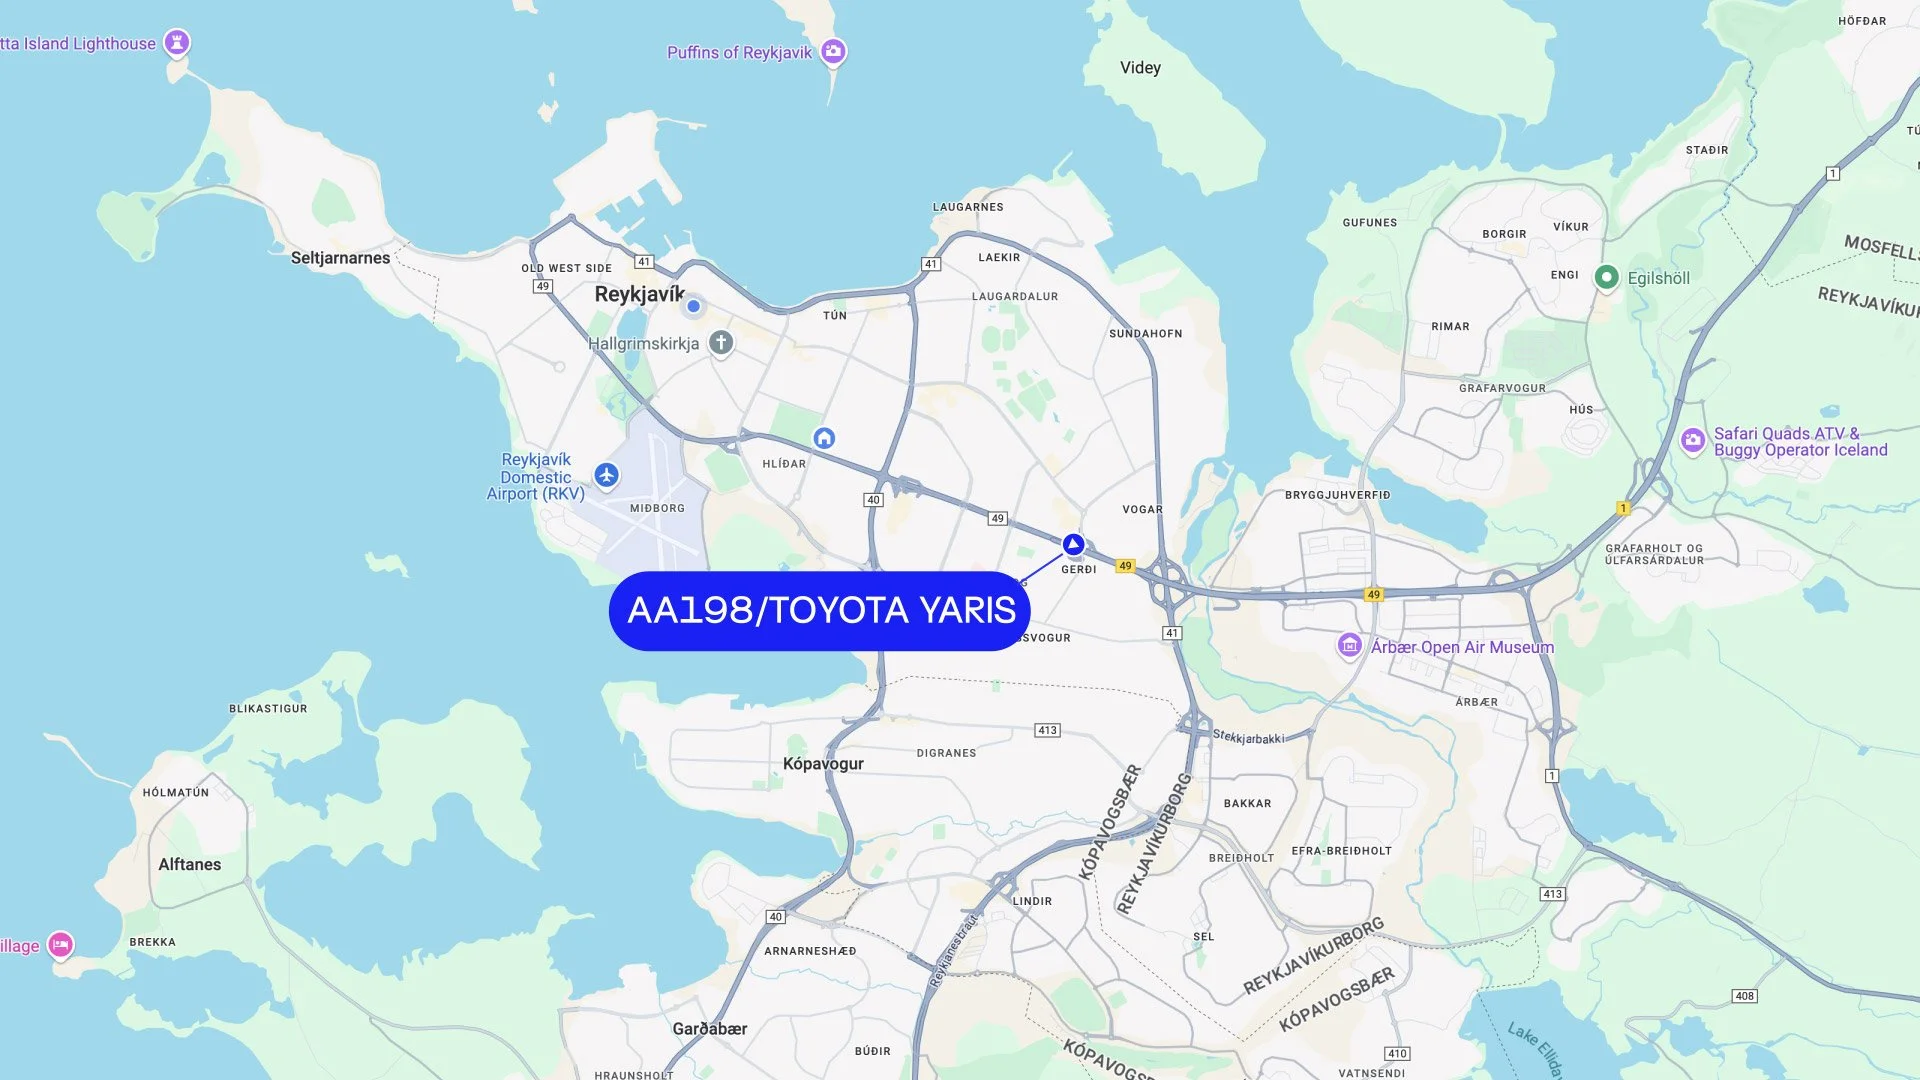
Map of Reykjavik, Iceland, highlighting the route AA198/Toyota Yaris.
Blurred image of a highway with multiple trucks, surrounded by fields and a clear sky, with digital icons overlaid indicating technology and data related to transportation.
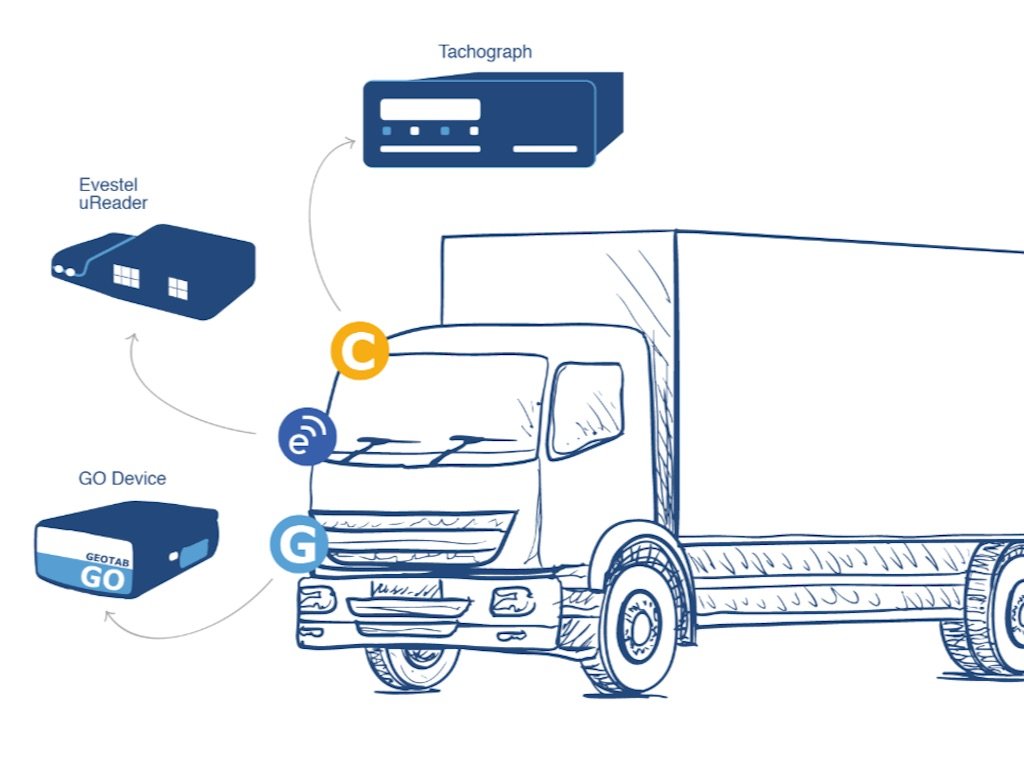
Diagram showing a GPS navigation system for a truck, including a Tachograph, a GO Device, and an Evestel uReader, with their connections to the truck.
Illustration of various industrial and construction vehicles surrounding a central letter 'G', connected by a network of lines and circles.